Credit Monitor: Which Ratings Don’t Match the Metrics?
We break down average credit ratios by agency rating

We calculated the median leverage, coverage and profitability ratios by agency rating to show how credit fundamentals shift from the highest investment-grade names down to the riskiest high-yield issuers.
We found that over 10% of BBB issuers have weak fundamentals that are severely misaligned with their ratings, and therefore at risk of agency downgrades.
The BBB Issuers with the highest near-term downgrade risk include Crown Castle, Inc., Albermarle Corp., and Huntsman Corp., all of which are on negative outlook at one or more rating agencies.
With first-quarter earnings season now complete, we are launching our Credit Monitor—a recurring series that tracks key trends and metrics relevant to credit investors. This inaugural issue offers a data-driven snapshot of how rating agencies are, on average, linking financial ratios to credit ratings. Drawing on 2025 Q1 data from more than 750 U.S. non-financial corporate bond issuers, we analyze five core financial metrics, grouped into three functional categories: leverage, interest coverage, and profitability. For each rating bucket, we report the median value of these metrics, highlighting how financial strength and credit ratings are currently aligned in the market.
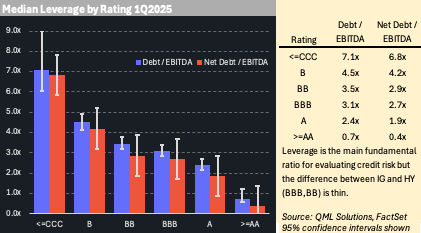
Leverage
We use debt-to-EBITDA and net debt-to-EBITDA to assess corporate leverage. As expected, median debt ratios rise steadily as credit ratings decline. A-rated companies report median gross leverage of 2.4x, which increases to 3.1x for BBB-rated firms and 3.5x for BB-rated firms. The leverage gap between BBB and BB—the dividing line between investment grade and high yield—is relatively narrow at just 0.4x. This contrasts with the wider 1.0x gap between BB and B, and the 0.7x difference between BBB and A. Moreover, the confidence intervals for BBB and BB medians overlap, underscoring the thin statistical distinction between the leverage for these ratings.
We’ve previously written extensively about corporate leverage, including the secular rise in debt levels over the past two decades and the identification of firms vulnerable to outsized equity losses due to highly leveraged balance sheets.
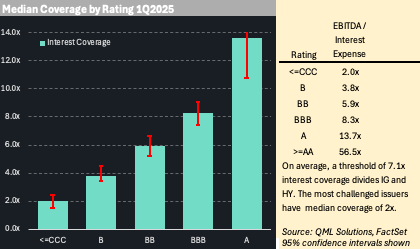
Interest Coverage
We use EBITDA-to-interest expense as a measure of debt service capacity. The pattern here is similarly intuitive, though perhaps more revealing in today’s environment of elevated interest costs. A-rated companies report median interest coverage above 13x. Among BBB-rated issuers, the fulcrum between investment grade and high yield, the median drops sharply to approximately 8.3x. Below investment grade, coverage deteriorates quickly: BB-rated firms post a median around 5.9x, while B-rated firms fall below 3.8x.
We have also written about the rise in effective interest rates companies must now pay as a result of the refinancing cycle, as well as the vulnerability of coverage ratios in the event of an earnings downturn.
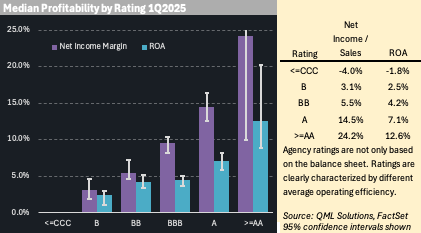
Profitability
We assess profitability using net income margin and return on assets (ROA), two broad measures of operating efficiency. Median net income margin declines from 16.4% for A-rated firms to 10.4% for BBB issuers, 7.2% for BB and 4.6% for single-B. ROA similarly declines from 8.2% for A-rated issuers and drops to 5.1% for both BBB and BB issuers, and down to 3.0% for those rated single-B.
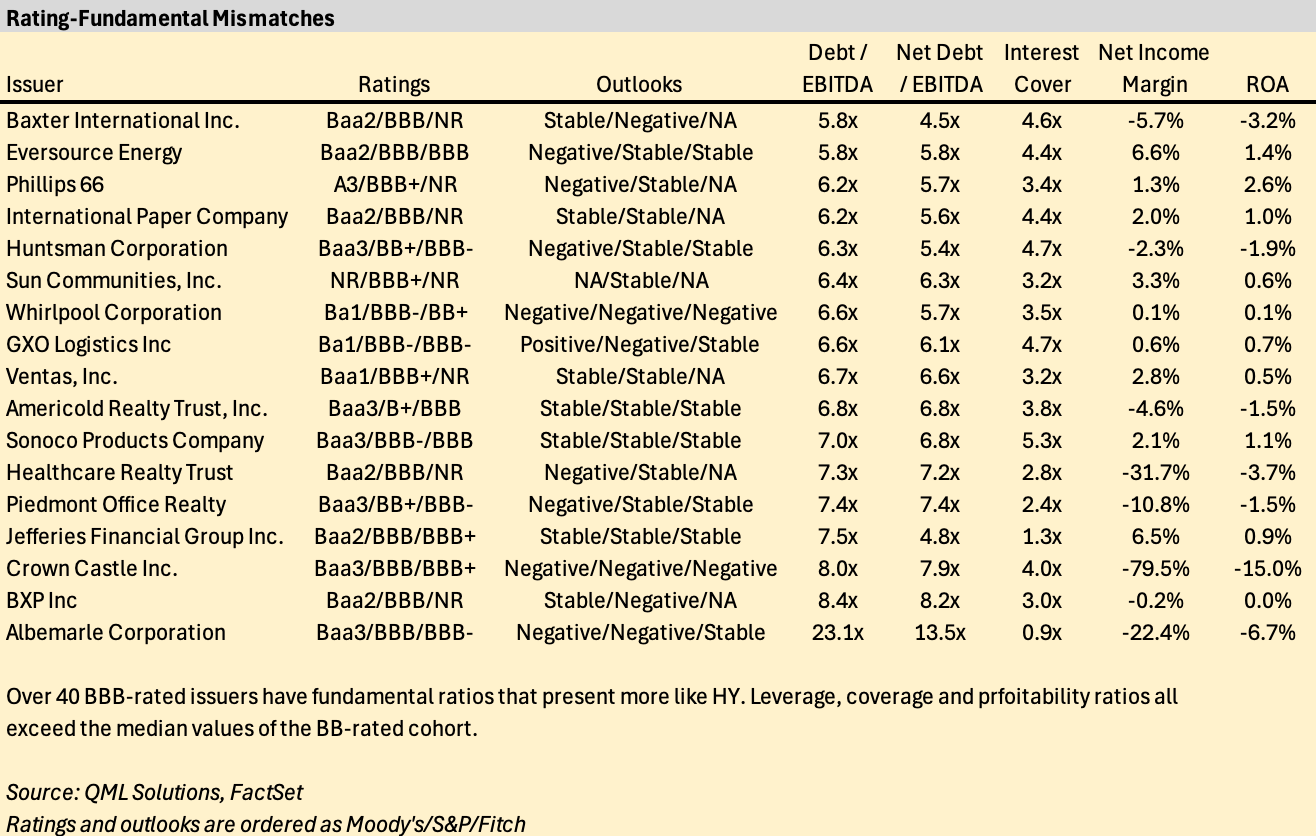
Rating Mismatches
By comparing individual companies’ financial metrics to the median values for each rating category, we can identify potential rating mismatches where issuer fundamentals deviate significantly from those of their rating peer group. As a case study, we focus on the BBB-rated universe, screening for companies whose financial profiles more closely resemble those of high-yield (BB-rated) issuers.
Our analysis finds that 41 of 326 BBB-rated companies (12%) exhibit materially weaker financials across all three key dimensions: higher leverage, lower interest coverage, and reduced profitability. While credit ratings also reflect qualitative considerations such as business model strength, market positioning, and capital access, these outliers highlight potential misalignments between assigned ratings and underlying financial risk. A selection of these 41 companies is presented below.
The content published by QML Solutions is for informational and educational purposes only and should not be construed as investment advice, a recommendation, or an offer to buy or sell any security or financial instrument. The views expressed are solely those of the authors and are subject to change without notice. While we strive for accuracy, we make no guarantees about the completeness or reliability of any information presented.Any investment decisions should be made in consultation with a qualified financial advisor and based on your own objectives, financial situation, and risk tolerance. QML Solutions and its authors disclaim any liability for any direct or consequential loss arising from reliance on the information provided.