Fallen Angels Part 2: Forced Selling and Recovery
We analyzed over 1,100 fallen angel bonds to show how fallen angels are sold as a category before downgrade, and priced as credits after the downgrade.

Spread widening and negative returns are similar across all fallen angels prior to downgrade, indicating forced selling rather than fundamental differentiation.
Across our sample of 1,188 fallen angel bonds, the median option-adjusted spread over BBB bonds widened from 56 bp one year prior to downgrade to 278 bp in the month of the downgrade to high yield.
Once fallen angel bonds enter the high-yield universe, spreads and returns diverge sharply as fundamentals reassert themselves. Losses incurred ahead of downgrade are typically recovered post-downgrade, but only for issuers whose credit profiles stabilize.
Bonds that ultimately returned to investment grade tightened aggressively following downgrade, reaching a median spread over BBBs of 70 bp three years later. Bonds that remained high yield exhibited more modest tightening, stabilizing around 197 bp.
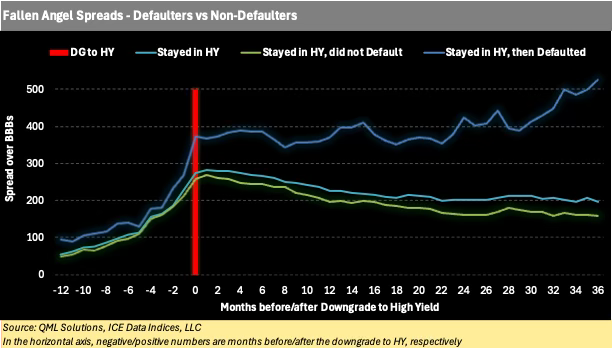
In contrast, bonds that later defaulted showed little evidence of spread compression, with spreads over BBBs widening beyond 500 bp three years after downgrade.
From Tight Spreads to Downgrades
U.S. investment-grade (IG) spreads are hovering near cyclical tights, with the ICE BofA US IG index trading around 80 bp — less than half its long-term median of 170 bp. Beneath this apparent stability, risk continues to build in the BBB segment, which now totals approximately $4.2 trillion, over 40% of the U.S. IG market. More than 20% of BBB debt sits just one notch above high yield.
With over $150 bn of low-BBB debt maturing in 2026–2027, Part 1 of this series identified the issuers most vulnerable to downgrade, focusing on leverage, interest coverage, and refinancing risk. This report shifts the focus from who may be downgraded to what happens when the downgrade occurs. Using a large historical sample of fallen angels, we analyze the behavior of spreads and total returns before and after the transition from IG to high yield, with particular attention to the role of forced selling. We also examine the longer-term lifecycle of fallen angels, including time to default, and the probability of returning to investment grade.
Where Do the Fallen Angels Go?
Using the US IG and HY indices from ICE Data Indices LLC, we compiled a sample of option-adjusted spread (OAS) and price data for 1,188 senior bonds that became fallen angels between 1998 and 2023:
390 bonds (33%) were subsequently upgraded back to investment grade (“rising stars”). The median time from downgrade to upgrade was 2.8 years.
624 bonds (53%) remained in high yield but did not default over the observation period.
190 bonds (16%) eventually defaulted, with a median time from downgrade to default of 3.6 years.
The above percentages don’t sum to 100%, as a small number of bonds (e.g. Ford) defaulted, and then became rising stars many years later.
These statistics highlight two important features of fallen angels. First, default is not the dominant outcome — the majority of fallen angels survive as going concerns. Second, recovery or failure typically plays out over multiple years, making the downgrade event itself a critical inflection point for spreads and returns.
Spread Dynamics Before and After the Downgrade
We tracked the option-adjusted spread of each fallen angel bond relative to BBB-rated debt (“spread over BBBs”) from one year prior to the downgrade to three years after the downgrade.
Across all fallen angels, the median spread over BBBs widened from 56 bp one year prior to downgrade to 278 bp in the month of downgrade. After the downgrade, spreads tightened meaningfully, falling to 142 bp three years later.
The chart below compares this spread trajectory for all fallen angels with two sub-groups: bonds that later returned to investment grade and bonds that remained in high yield. A striking feature of the chart is the similarity in pre-downgrade spread behavior across all fallen angel sub-groups, regardless of eventual outcome. Bonds that later returned to investment grade and bonds that remained in high yield experienced very similar median spread widening in the year leading up to downgrade.
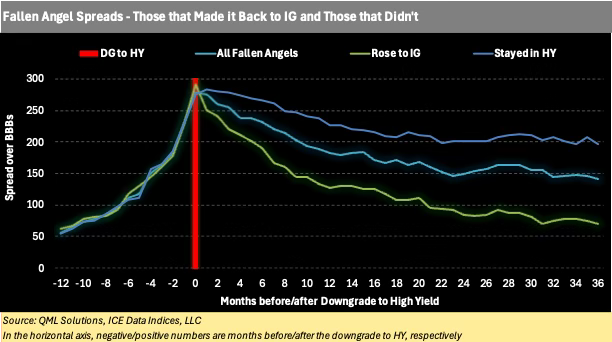
This suggests that pre-downgrade pricing is driven less by issuer-specific credit fundamentals and more by technical and structural factors, most notably the anticipation of forced selling by IG-only investors. As downgrade risk rises, bonds are increasingly sold in advance of rating action to avoid index exclusion, mandate breaches, and liquidity shocks, even when underlying credit trajectories differ meaningfully.
The divergence in spreads only emerges after the downgrade to high yield. While pre-downgrade widening is broadly indiscriminate, post-downgrade spread paths differ sharply across sub-groups. Bonds that ultimately returned to investment grade tightened aggressively following downgrade, reaching a median spread of 70 bp three years later. Bonds that remained high yield exhibited more modest tightening, stabilizing around 197 bp. In contrast, bonds that later defaulted showed little evidence of spread compression, with spreads widening beyond 500 bp three years after downgrade.
In other words, credit differentiation is delayed until after forced selling has run its course, at which point valuation, liquidity, and fundamentals begin to matter again.
Total Return Performance
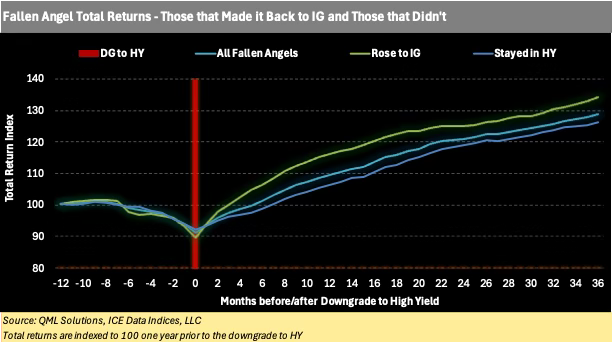
To translate spread dynamics into investor outcomes, we analyzed total return indices for each group of fallen angel bonds, rebased to 100 one year prior to downgrade.
Across all fallen angels, total returns were negative in the year preceding downgrade, with cumulative losses of approximately -10%. These losses were typically recovered within 6-9 months following the downgrade to high yield, as selling pressure abated and bonds entered the HY investor universe. Importantly, returns continued to compound beyond the initial rebound, reaching 40-50% cumulatively three years after downgrade.
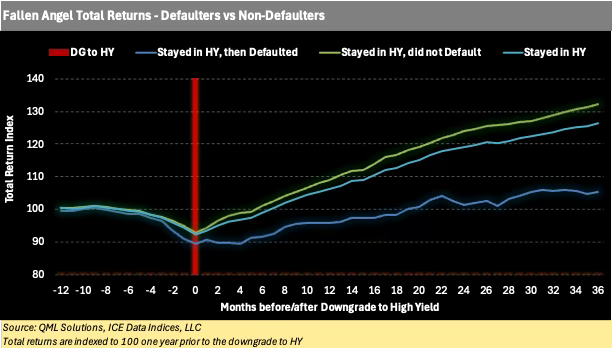
This aggregate performance masks substantial dispersion. Among fallen angels that remained high yield, bonds that ultimately defaulted generated much weaker returns, with a cumulative total return of only 18% three years after downgrade. In these cases, forced selling was not followed by recovery, and price declines continued to dominate returns.
Our analysis highlights that fallen angels are defined as much by market structure as by fundamentals. Forced selling at the point of downgrade creates both risks and opportunities, but outcomes depend critically on whether credit deterioration stabilizes or accelerates.
The content published by QML Solutions is for informational and educational purposes only and should not be construed as investment advice, a recommendation, or an offer to buy or sell any security or financial instrument. The views expressed are solely those of the authors and are subject to change without notice. While we strive for accuracy, we make no guarantees about the completeness or reliability of any information presented.Any investment decisions should be made in consultation with a qualified financial advisor and based on your own objectives, financial situation, and risk tolerance. QML Solutions and its authors disclaim any liability for any direct or consequential loss arising from reliance on the information provided.