The Drivers of Equity Drawdowns: Identifying Vulnerable S&P 500 Companies
Building on our earlier work on leverage and market stress, we introduce a simple but effective model to help identify the S&P 500 companies most at risk of sharp equity drawdowns in a recession.

Equity sensitivity to shocks is predictable: Beyond leverage, short-term price momentum and volatility are powerful indicators of downside risk during systemic stress events.
Valuation extremes are risky: Both high and low price-to-earnings (P/E) ratios tend to be associated with greater equity declines in downturns.
Energy, Technology and Real Estate stand out: These sectors show elevated risk based on a combination of weak momentum, high volatility, stretched valuations, and heavy debt burdens.
15 companies flagged: Our new vulnerability score highlights a set of S&P 500 companies, including large names like Intel and CrowdStrike, each with characteristics that could amplify losses in a macroeconomic shock.
Methodology
In a previous article, we showed that the increase in leverage across the S&P 500 over the past 20 years could amplify potential equity losses when the US enters a recession. This article builds on that research to work out which company-level characteristics are most predictive of future downside performance.
We evaluated S&P 500 companies’ sensitivity to economic shocks using historical data from three periods of systemic stress:
Global Financial Crisis (2007–2010)
Commodity Crisis (2014–2016)
COVID Shock (2020–2023)
Using these episodes, we built a regression model to explain the severity of equity drawdowns based on four company-level inputs:

Key insights from the model:
Momentum (β₁ > 0): Strong recent returns are protective; lagging stocks are more vulnerable.
Volatility (β₂ < 0): Higher recent price volatility is associated with larger future drawdowns.
Valuation (β₃ non-linear): Both very high and very low P/E ratios signal increased risk.
Leverage (β₄ < 0): Companies with higher debt relative to earnings experience deeper losses in downturns.
Scoring the S&P 500
Applying the model across the S&P 500 (excluding financials), we assigned each company a Vulnerability Score from 1 (least vulnerable) to 100 (most vulnerable).The table below shows the average score for each S&P 500 non-financial sector, along with the drivers of the score.
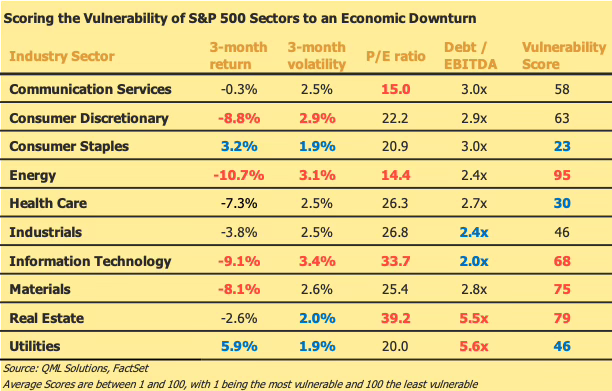
The Energy and Technology sectors stand out due to their recent weak equity performance, while the Real Estate and Utilities sectors have the highest debt/EBITDA ratios. Overall, Energy comes out with by far the lowest score, implying that the Energy sector is likely to be the most exposed to an economic downturn. Real Estate, Materials and Information Technology also have relatively high average scores, indicating pockets of vulnerability in these sectors.
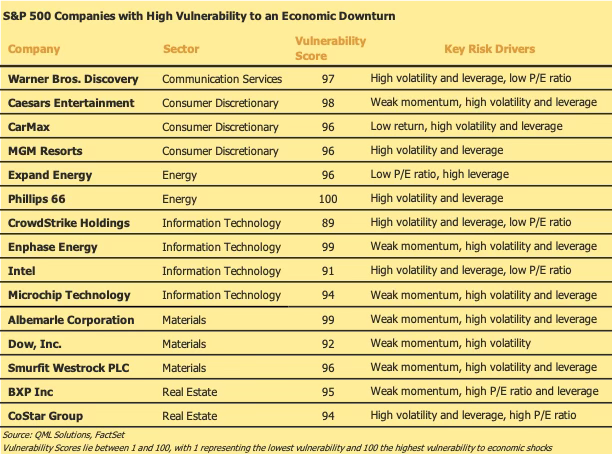
Which Companies are Most at Risk?
We highlight below 15 S&P 500 companies with scores above 85, representing firms most at risk of significant drawdowns should macro conditions deteriorate. Each company exhibits a blend of poor return performance, high volatility, stretched valuations, and/or heavy debt loads. The full list of companies is available on request.
Concluding Remarks
As investors seek resilience in portfolios, understanding not just sectors—but individual companies—at risk from a macro shock becomes essential. Our scoring model offers a simple framework to guide that process. In coming updates, we will explore how these risks evolve as market conditions change, and how pricing may or may not reflect the growing refinancing burden and earnings fragility embedded in parts of the index.
The content published by QML Solutions is for informational and educational purposes only and should not be construed as investment advice, a recommendation, or an offer to buy or sell any security or financial instrument. The views expressed are solely those of the authors and are subject to change without notice. While we strive for accuracy, we make no guarantees about the completeness or reliability of any information presented.Any investment decisions should be made in consultation with a qualified financial advisor and based on your own objectives, financial situation, and risk tolerance. QML Solutions and its authors disclaim any liability for any direct or consequential loss arising from reliance on the information provided.