The Leveraged Landscape: S&P 500 Vulnerability to Economic Shock
The increase in leverage across the S&P 500 is setting the market up for a harder fall during the next economic shock.

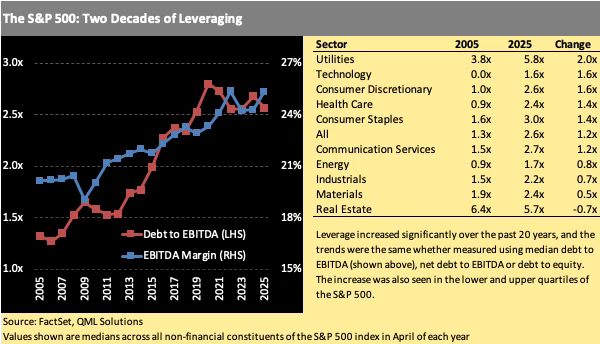
Over the past two decades, leverage has steadily increased across US public companies.
Our analysis of past market crises shows that when earnings fall significantly, leverage tends to amplify the resulting equity price declines.
Using the Global Financial Crisis (GFC) as a point of reference, we estimate potential equity drawdowns across S&P 500 non-financial sectors.
The resulting S&P 500 drawdown of 63% is significantly higher than the 52% we experienced during the GFC, confirming that leverage has made the S&P 500 more vulnerable to systemic shocks.
The three of us at QML Solutions are excited to debut our first article, drawing on our collective experience of over 50 years in investment research across equity and credit from strategy and quant desks. We bring an inquisitive quantitative perspective to our analysis, leveraging a strong command of data and statistics to support our ideas, as we aim to demonstrate in this article. Our goal is to provide you with differentiated research that offers fresh insights into equity and credit market dynamics. We encourage you to send us your questions, comments, and any research topics you think we should explore.
The Buildup of Leverage
Over the past two decades, financial leverage across US public companies has been steadily increasing, with debt-to-EBITDA increasing a full turn from below 1.5x in 2005 to above 2.5x today. In recent years this higher leverage has been offset by declining interest rates, healthy earnings growth and a supportive cushion of increasing profit margins. In “good times” increases in leverage have the effect of amplifying equity returns, helping to drive the S&P 500 to the record highs we saw last year.
Times have obviously changed. The current market volatility resulting from the introduction of a slew of tariffs has bruised investor confidence in US assets, and raised the grim prospect of an economic downturn within the next 1-2 years. If (or more likely when) the US heads into a recession, equity markets will adjust significantly to reflect the slowdown in corporate earnings growth. The buildup of S&P 500 leverage will mean that this adjustment will be more severe. Just as leverage amplifies gains on the way up, it exacerbates losses on the way down.
In this article we estimate the drawdown in the S&P 500 that could result from shocks to corporate earnings, as the negative feedback loop of earnings declines, lower consumer confidence and negative investor sentiment begins to take hold. To do this, we examine the interplay between leverage, earnings decline and equity drawdowns in three past market crises: The Global Financial Crisis, the Commodity Crisis and COVID.
The combination of trade war, declining consumer sentiment and a freeze in business planning will lead to slower economic growth with some echoes of the Commodity Crisis and COVID recession, but on its own the slowdown is unlikely a systemic shock on the scale of the Global Financial Crisis (GFC). However, capital flight based on usurped Fed independence, weakened dollar dominance and the lost status of the US as a safe haven would constitute the type of systemic shock that would be unprecedented, with a wide range of possible outcomes.
In our view a GFC-level shock to the US economy remains the less likely outcome, but it's a real possibility that is very much driven by a single unpredictable personality who's risk tolerance is higher than most other decision makers.
Lessons From Past Crises
We looked at the relationship between leverage, earnings declines and equity price drops for S&P 500 companies during three negative economic shocks: the Global Financial Crisis (GFC) between 2007 and 2010, the Commodity Crisis from 2014 to 2016, and the COVID pandemic between 2020 and 2023. We exclude “normal” economic growth regimes because we specifically want to isolate downside behavior. Using company data from the three crises, we performed a regression to model drops in stock prices using future earnings declines and leverage. In all cases, we saw that companies with higher leverage were associated with more extreme equity price declines. It didn’t matter what type of leverage (debt to EBITDA, net debt to EBITDA, or debt to equity) or earnings (EBITDA, EBIT, or net income) we used – in all cases companies with higher leverage saw more extreme equity price drops and the effect was highly statistically significant. Our regression model uses the equation below:

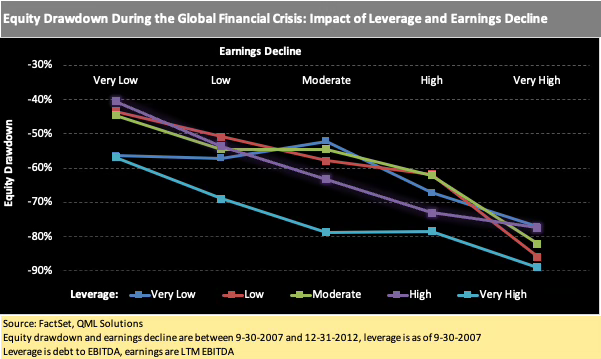
The chart below illustrates the relationship between equity drawdown, earnings decline and leverage for S&P 500 companies during the GFC. Similar behavior was observed for the other market crises. Earnings declines (percentage drop in LTM EBITDA) and leverage (debt to EBITDA) are grouped into five buckets, from Very Low to Very High. Each line in the chart shows how equity drawdowns vary as the earnings decline becomes more severe, for a given range of leverage. For example, the bottom line in the chart (companies with Very High leverage) shows that as the earnings decline varies from Very Low to Very High, the equity drawdown increases from -57% to -89%. While the equity drawdown varies more widely as earnings decline more rapidly, it is clear that leverage, particularly Very High leverage, has a strong negative impact on equity drawdown.
Estimating an S&P 500 Drawdown
Although we don’t expect the next downturn to be as severe as the GFC, it’s a useful exercise to estimate the potential drawdown that could result from GFC-level shocks to earnings. This gives us a worst-case scenario that can inform base-case estimates.
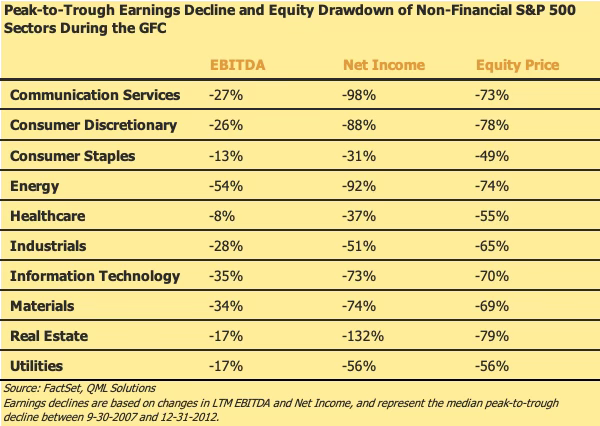
To estimate the potential decline in equity prices, we started by looking at the actual earnings declines that occurred during the GFC. The table below shows the median drop in EBITDA and net income for each non-financial S&P sector between 9-30-2007 and 12-31-2012, along with the realized equity drawdown.
To convert the earnings declines in the above table to a potential equity drawdown for the sector, we used the previously mentioned regression model that links the equity drawdown to leverage. The overall equity drawdown for each sector was then modeled using three components: a ‘baseline’ estimate that accounts for systemic risk and its impact on investor sentiment (the model’s intercept), a second component that accounts for variations in the realized earnings slowdown within the sector, and company-specific leverage.
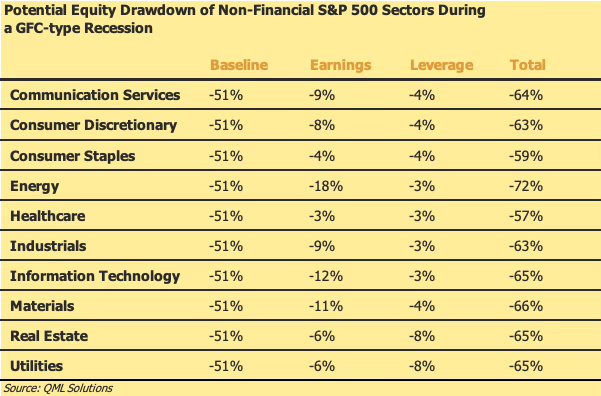
At the sector level, expectations of earnings slowdown are the main driver of equity drawdown, with estimates ranging from -3% for Healthcare to -18% for Energy. However, the impact of leverage is significant, ranging from -3% for low-leverage sectors to -8% for more highly leverage sectors. Leverage plays an even greater role at the company level, where companies with very high leverage (above 4x) are vulnerable to more extreme equity price declines in a period of systemic market stress. For example, a company with debt to EBITDA between 5x and 6x could suffer an additional equity drawdown of between eight and ten percentage points. This will be the subject of a forthcoming article.
To estimate the overall drawdown for the S&P 500 index, we calculated a market-weighted average drawdown by multiplying each company’s drawdown by its index weight. The resulting index drawdown is 63%, significantly higher than the 52% price decline we saw between October 2007 and February 2009. While we don’t expect the next recession to mirror the GFC, we can be confident that leverage will amplify the volatility in the S&P 500 as economic conditions begin to deteriorate.
The content published by QML Solutions is for informational and educational purposes only and should not be construed as investment advice, a recommendation, or an offer to buy or sell any security or financial instrument. The views expressed are solely those of the authors and are subject to change without notice. While we strive for accuracy, we make no guarantees about the completeness or reliability of any information presented.Any investment decisions should be made in consultation with a qualified financial advisor and based on your own objectives, financial situation, and risk tolerance. QML Solutions and its authors disclaim any liability for any direct or consequential loss arising from reliance on the information provided.