The Quiet Squeeze: How Refinancing Risk Is Eroding Corporate Margins
We quantify which sectors face the most pressure as maturing debt rolls into a higher-rate environment.

Even with the Fed on pause, corporate interest costs keep climbing as cheap legacy debt rolls into today’s higher-rate market.
The effective interest rate companies pay on their debt has jumped nearly 100 bp from its 2023 low, erasing a third of its decades-long decline.
Our new Refinancing Burden Score identifies where rising debt costs will most pressure margins—especially when scaled to EBITDA or net income.
The longer the Fed holds rates, the more earnings erosion accumulates beneath the surface, especially in highly leveraged or capital-intensive sectors.
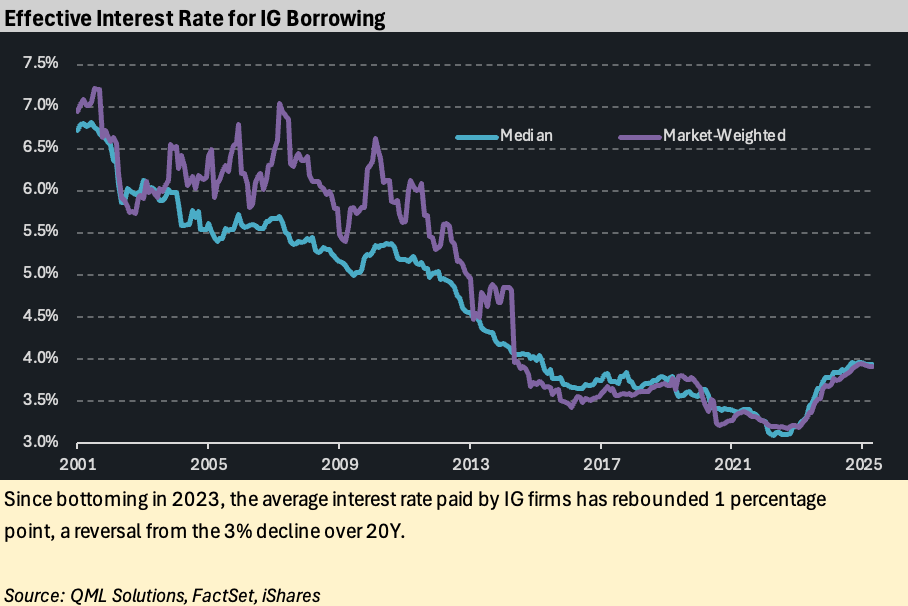
The Fed has been in cut/pause mode since last Fall, but the interest rate companies are paying continues to rise into the summer of 2025. The reason is simple and mechanical: maturing low-cost legacy debt is refinancing into a higher market rate environment. Since a historical low effective interest rate of 3.1% in 2023, the median company is now paying almost a percentage point more. That retraces almost a third of the 300 bp decline in interest rates that fueled the market over the past two decades. Combined with general input cost inflation and a slowdown in economic activity, the added interest cost will stress earnings and do so unevenly across sectors. The longer the Fed stays in the “wait and see” mindset, the more companies will be exposed to this interest rate creep.
Our analysis focuses on ~400 investment grade debt issuers in the iShares iBoxx $ Investment Grade Corporate Bond ETF (ticker LQD), a liquid subset of the larger corporate bond universe. The refinancing risk story is broken into three parts:
· In part 1 of this article, we recap the fall and recent rise of effective interest rates to frame the problem.
· In part 2 we cover forward maturity schedules to set the stage for which sectors may have to refinance into an adverse market.
· Finally in part 3 we generate a score that combines higher interest costs with the amount to be refinanced.
Part 1: Incremental Cost on Debt
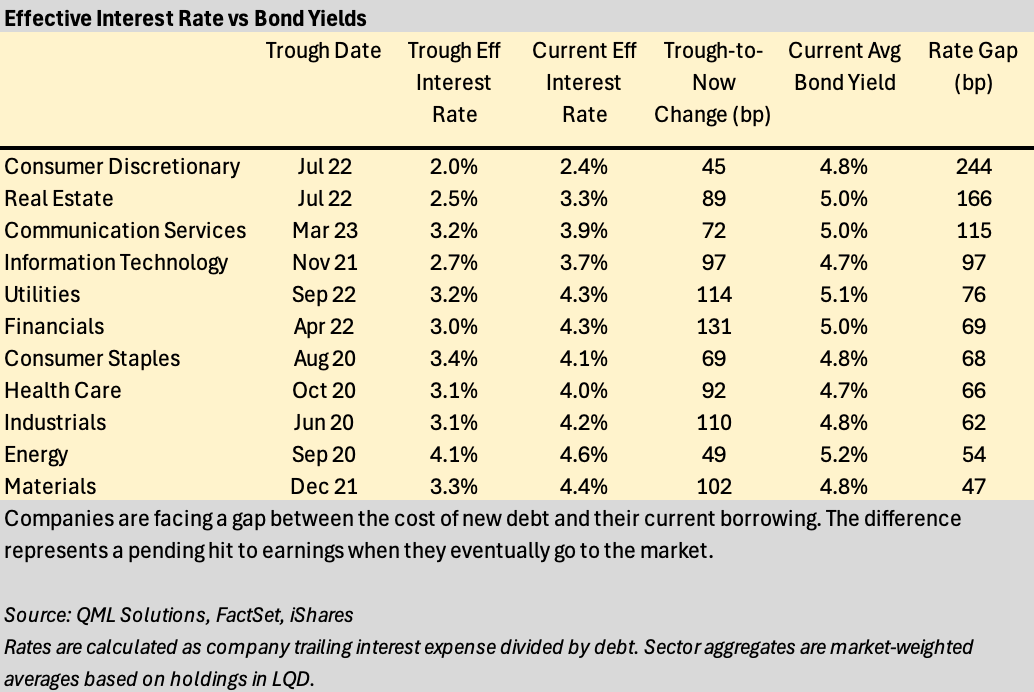
The median effective interest rate, defined as the trailing twelve-month interest expense divided by total debt, touched its lowest level in Spring 2022, with different sectors reaching their trough at different dates. The effective interest rate represents the actual cost companies are paying, in contrast to the current market yield of debt which represents an approximate cost of future, new borrowing.
Financials, Industrials and Utilities have seen some of the steepest increases in effective interest costs, with increases of 130 bp, 110 bp and 110 bp respectively to today. These effective rates will continue to rise if refinanced debt has an interest rate that exceeds the maturing debt’s rate, or if new debt issuance is issued at higher yield than the current effective rate. For simplicity we consider the spread between each issuer’s average bond yield and the effective interest rate as a measure of the direction and magnitude that the refinancing cycle will have on future incremental interest costs.
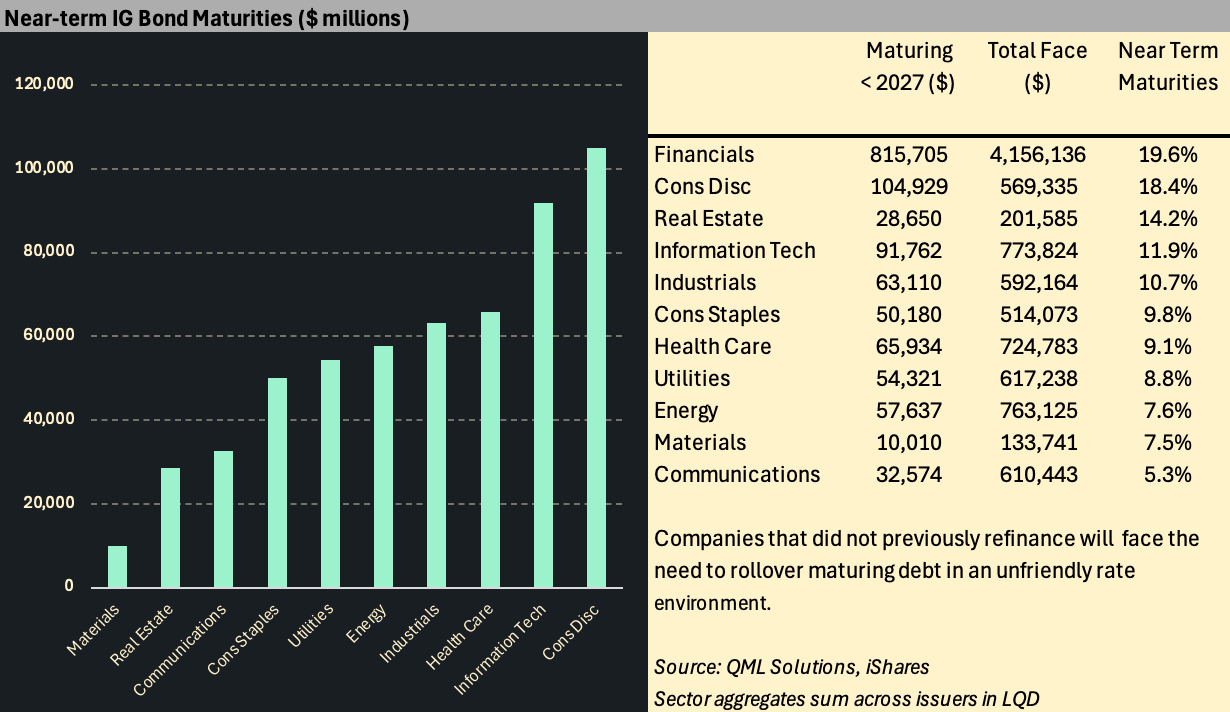
Part 2: Size of the Maturity Volume
We’ve summed the total face value of index-eligible bonds from issuers that mature before 2027, providing an estimate of the debt that is most exposed to refinancing risk during the ongoing Fed pause. Not all maturing debt will need to be refinanced, especially for companies that took the opportunity to raise cash in earlier, low-rate windows. Certain sectors however have sizeable proportions of their debt maturing in the near-term, including Financials, Consumer Discretionary and Real Estate.
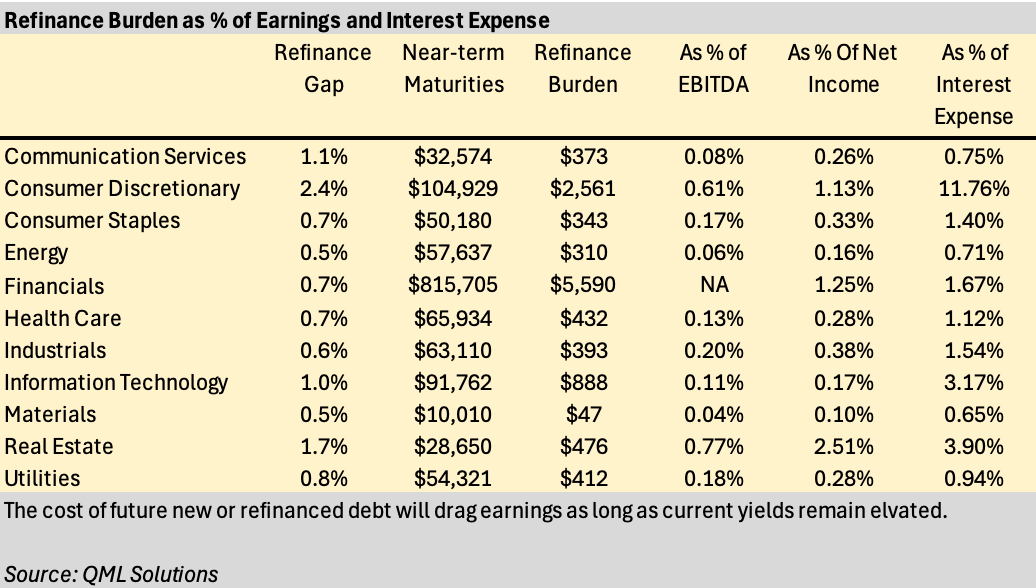
Part 3: Refinance Burden Score
We combine the above into a company-level score that estimates the increase in interest expense. The score accounts for both the incremental cost of new debt and the scale of borrowing needs:
(Avg Yield – Effective Rate) × (Debt Maturing in 2025–2026)
The score captures refinancing-driven stress on earnings and is particularly meaningful when scaled relative to EBITDA, net income, or interest expense. For example, the cost of the refinancing burden amounts to 0.77% and 0.68% of EBITDA for Real Estate and Consumer Discretionary sectors, respectively.
This metric allows us to flag sectors and issuers that may face margin compression and earnings risk purely from refinancing, even before accounting for other headwinds in the economy. In future reports, we will provide company-level estimates and explore ways to use the Refinancing Burden Score as a tool for assessing default risk, modeling credit spreads, and mapping relative value across the capital structure.
The content published by QML Solutions is for informational and educational purposes only and should not be construed as investment advice, a recommendation, or an offer to buy or sell any security or financial instrument. The views expressed are solely those of the authors and are subject to change without notice. While we strive for accuracy, we make no guarantees about the completeness or reliability of any information presented.Any investment decisions should be made in consultation with a qualified financial advisor and based on your own objectives, financial situation, and risk tolerance. QML Solutions and its authors disclaim any liability for any direct or consequential loss arising from reliance on the information provided.