

Stress Tested: Which S&P 500 Companies are Most Exposed to an Earnings Shock?
We apply earnings shocks from past recessions to today's S&P 500 index to find the sectors and companies that could suffer severe deterioration in leverage and interest coverage.

Applying GFC and COVID-era EBITDA declines to current S&P 500 financials shows that while most companies maintain manageable leverage, a significant minority experiences a sharp increase of over two turns.
Many firms see interest coverage ratios drop by more than five turns under stress, exposing them to refinancing and liquidity risks in a higher-rate environment.
Sector exposure is uneven, with Technology, Consumer Discretionary, and Energy sectors consistently showing the highest concentration of companies with severe balance sheet stress under both historical shock scenarios.
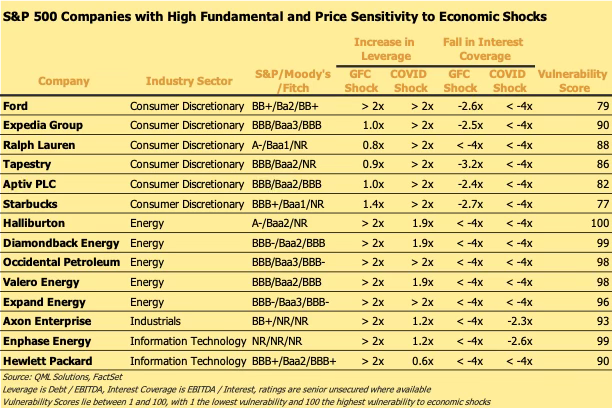
A significant number of companies – including Expedia, Halliburton and Hewlett Packard – that exhibit both high Vulnerability Scores and weakening of leverage/coverage could face dual pressure from credit deterioration and equity market drawdowns in a period of economic stress.
Introduction
As economic uncertainty mounts, investors are turning their attention from valuations to fundamentals, and specifically to earnings resilience. With GDP growth forecast to slow and global trade dynamics threatened by tariffs, the path forward for S&P 500 earnings has rarely looked more uncertain. In this note, we expand on our prior analysis of equity price vulnerability by exploring another dimension of risk: the balance sheet. What happens to corporate leverage and interest coverage when earnings take a hit? Which sectors—and companies—are most exposed?
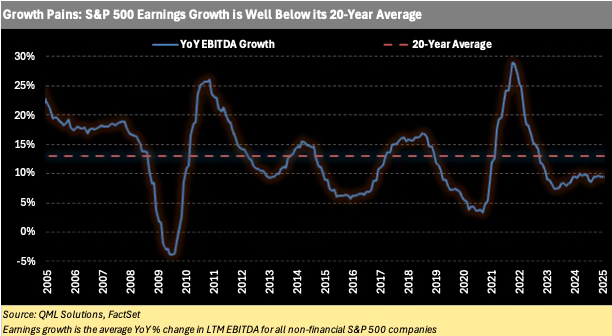
Following a strong post-COVID rebound, S&P 500 companies have seen year-over-year EBITDA growth decline sharply. As shown in the chart below, the average EBITDA growth across non-financial sectors has remained under 10% for the past two years, well below its 20-year average of 13%. An economic slowdown – especially one combined with rising inflation – would pose a serious threat to corporate earnings.
A Historical Lens: GFC and COVID as Templates
We used historical data on actual earnings declines from two major systemic market crises:
Global Financial Crisis (2007–2010)
COVID Pandemic (2020–2023)
For each crisis, we calculated the median peak-to-trough decline in LTM EBITDA for each non-financial industry sector in the S&P 500 index, and used this as the basis for our earnings shocks.
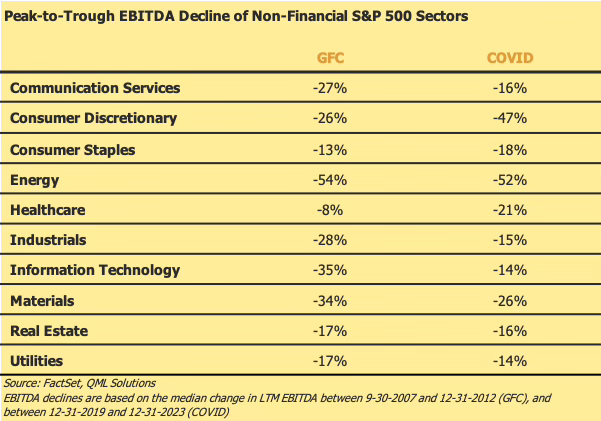
During the GFC the Energy, Technology and Materials sectors experienced the worst decline in EBITDA, while the Energy, Consumer Discretionary and Materials sectors were hardest hit during the COVID pandemic.
Stress Tests: Applying Shocks to Today’s S&P 500
Using company-level financial data as of April 30th, 2025, we applied these historical sector-specific EBITDA shocks to each S&P 500 constituent (excluding financials). We then recalculated two key credit metrics:
Leverage: Debt / EBITDA
Interest Coverage: EBITDA / Interest Expense
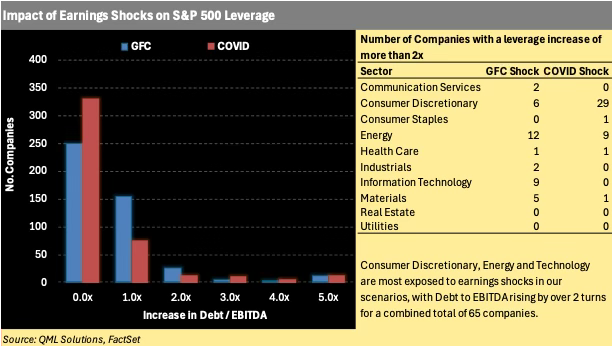
The chart below shows the distribution of changes in leverage. Most companies only suffer a negligible or modest increase, between 0 and 1 turn, but there is a large number of companies for which leverage increases by more than 2x – this is broken out by sector in the table to the right of the chart. The Consumer Discretionary, Energy and Technology sectors have the highest share of companies with outsized leverage increases. These sectors typically exhibit higher earnings volatility and carry greater operating leverage, making them more vulnerable to deterioration in financial health when earnings stall.
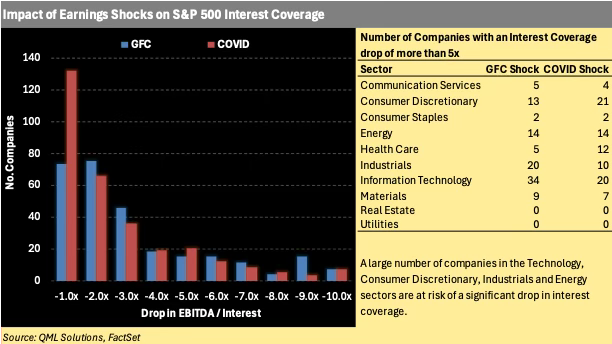
Changes in interest coverage follow a broadly similar pattern, with the majority of companies dropping between one and three turns of coverage. However, the tail of more severe declines in coverage extends further, with many companies shedding more than five turns. As with leverage, the majority of companies with more severe declines in interest coverage are in the Technology, Consumer Discretionary and Energy sectors.
This is particularly concerning in the current rate environment. While rates may stabilize, many companies have refinanced at higher coupons in recent years, increasing their exposure to earnings declines.
The Vulnerability Score: Identifying the At-Risk Cohort
In our prior note we introduced the Vulnerability Score—a proprietary composite that ranks companies based on price momentum, volatility, valuation, and leverage. We now overlay this score onto our earnings stress test.
The table below lists 14 S&P 500 companies that:
Exhibited severe changes in leverage or interest coverage under either the GFC or COVID shock scenarios; and
Rank in the upper quartile of our Vulnerability Score.
These names are at the intersection of market risk and fundamental fragility. While not all will see distress in the near term, they may be the most at risk if macro conditions worsen.
The content published by QML Solutions is for informational and educational purposes only and should not be construed as investment advice, a recommendation, or an offer to buy or sell any security or financial instrument. The views expressed are solely those of the authors and are subject to change without notice. While we strive for accuracy, we make no guarantees about the completeness or reliability of any information presented.Any investment decisions should be made in consultation with a qualified financial advisor and based on your own objectives, financial situation, and risk tolerance. QML Solutions and its authors disclaim any liability for any direct or consequential loss arising from reliance on the information provided.